
Table of Contents
1. How to use Deepler Explore
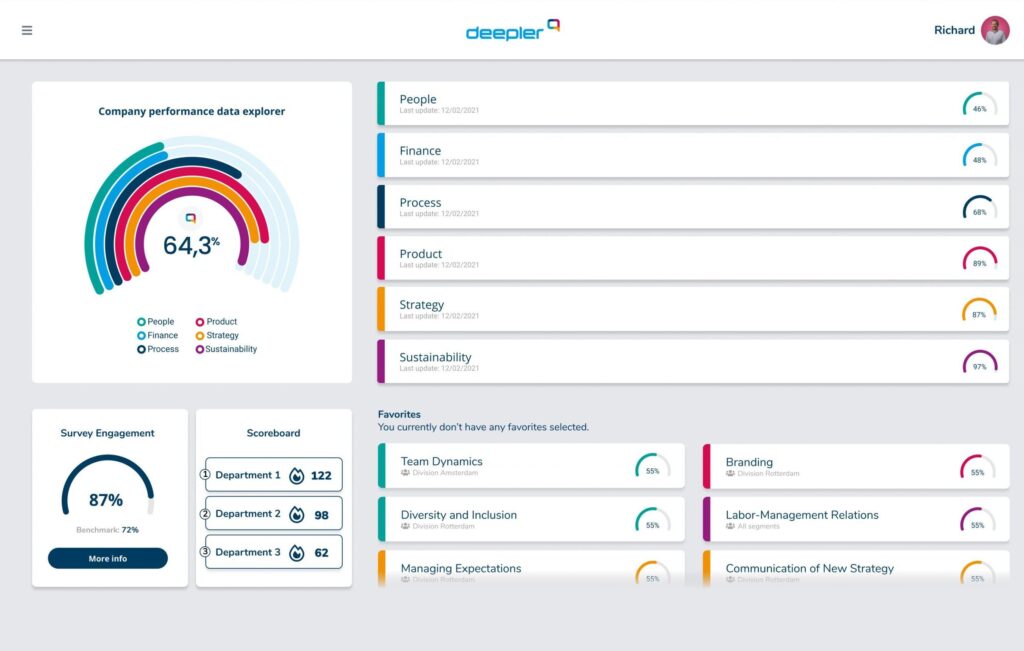
Deepler Explore or the Deepler Data explorer is where you can navigate the analyzed data from your employees’ surveys. For your convenience, this includes the: main meter, survey engagement scores, scoreboard, deepler pillars, and ongoing improvement projects.
2. Organization Performance meter
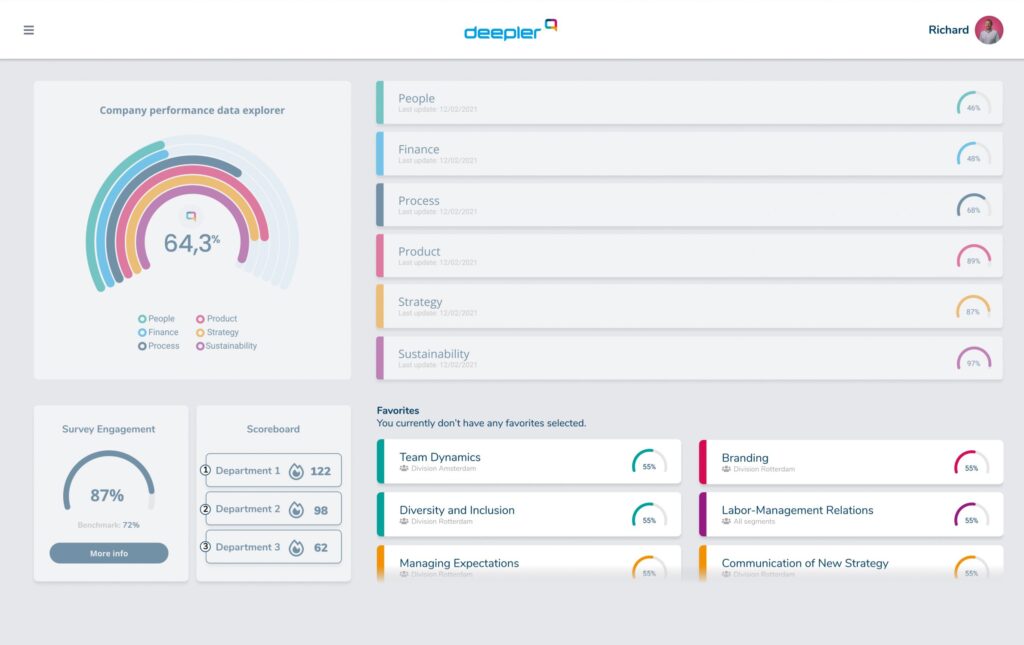
Main Meter
Shown here is the overall score for your organisation. The Deepler pillar scores are further broken it down, giving you an impression of where areas of improvement could lie. Each meter is representative of a Deepler pillar, as illustrated by the meter’s legend.
3. Survey Engagement module
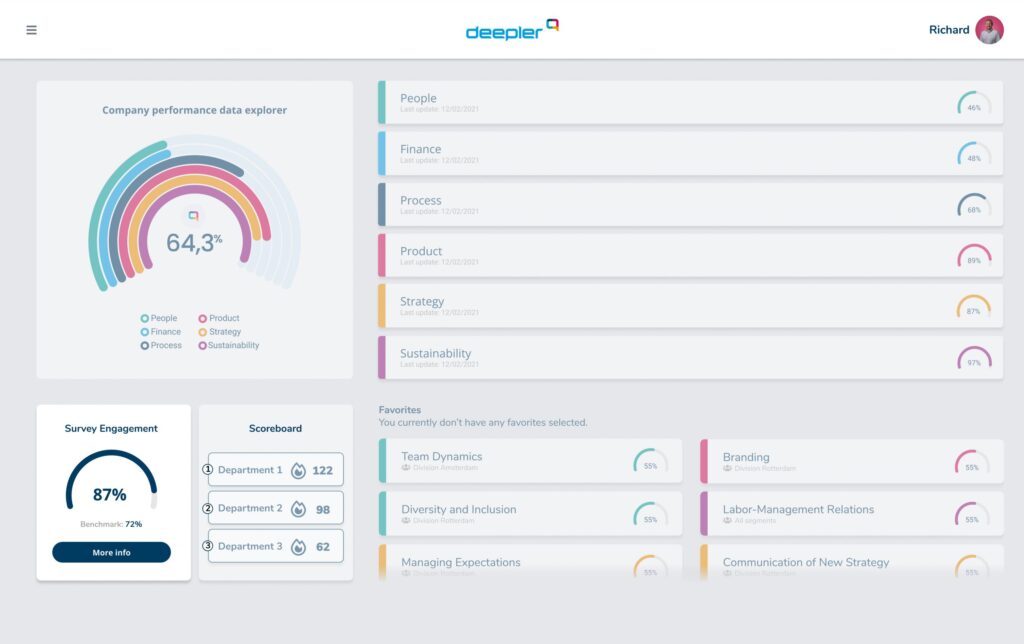
Survey engagement
Represented here is the percentage of employees that have answered their surveys at the intervals your organization has sent them. By clicking on the ‘more info’ button, you’ll be able to learn more about all of your previously sent-out surveys.
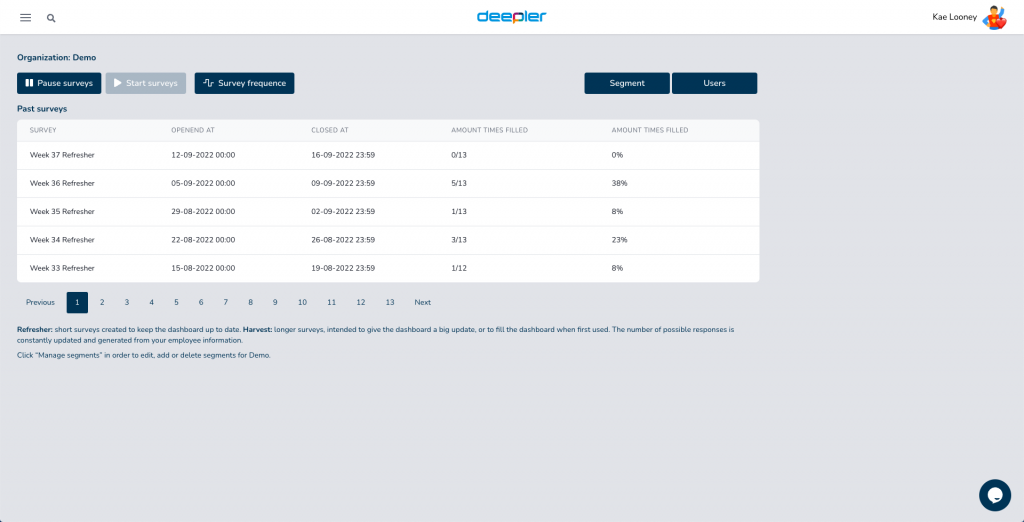
From left to right: The ‘survey’ column informs you of the name of the survey. ‘Opened at’ when the survey was first accessible by your employees. ‘Closed at’ when the survey stopped being accessible for employees to fill. ‘amount times filled’ informs you how many employees out of the total number filled out the survey and the percentage that translates to.
You will be able to pause surveys or start them here. Pausing surveys will stop them from being sent out to the employees of your organization for an indefinite time. Starting surveys will allow them to be automatically sent out once again at the preset periods of time.
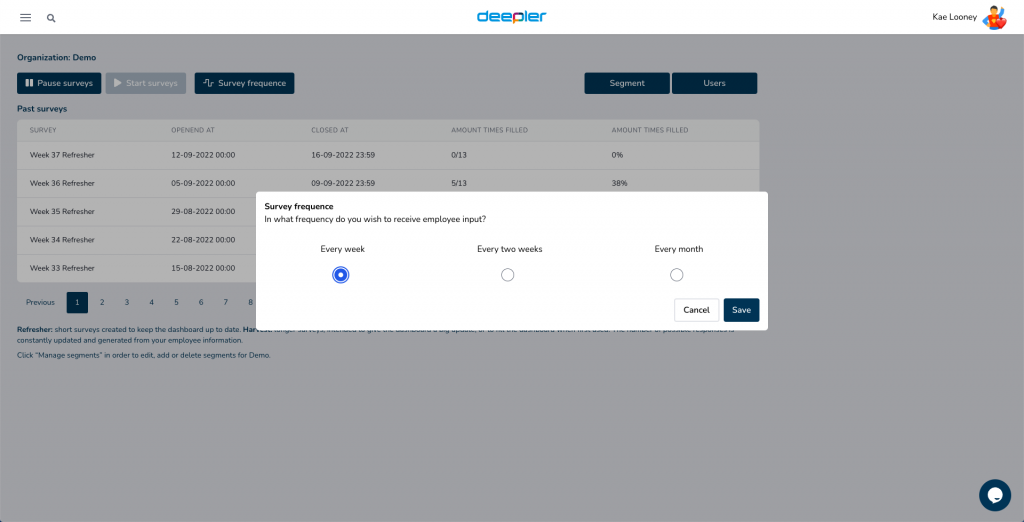
To alter your survey frequency, you can click on ‘survey frequence’ and select between every week, every two weeks, or every month then clicking ‘save’.
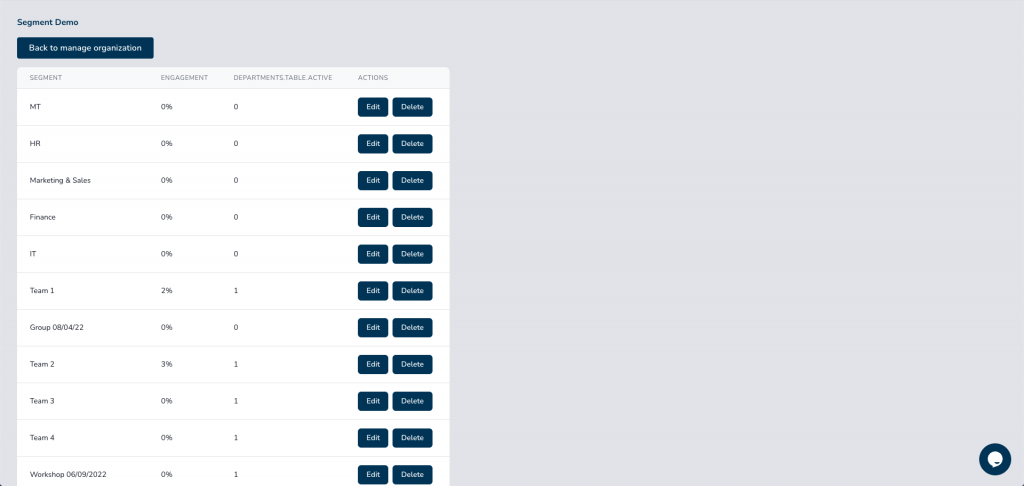
In ‘Segment’, you get a segment breakdown for survey engagement. In the ‘segment’ column is the title your organization has given the segment. ‘Engagement’ is the percentage of employees within that department that have filled out the survey. In the actions column, you can click ‘edit’ and change the segment’s title, or delete the segment altogether by clicking ‘delete’.
Clicking on ‘users’, will take you to the ‘manage employees’ module that you can learn more about here.
4. Scoreboard module
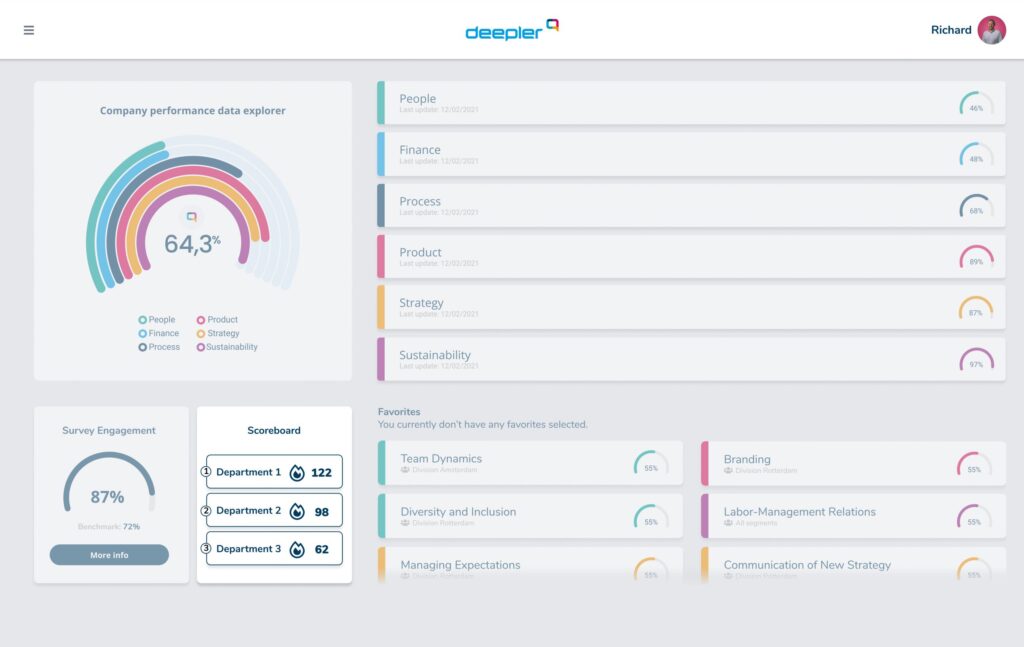
The Scoreboard ranks the segments by the percentage of employees within those segments who have answered their surveys. By clicking on ‘show more’, you’ll see each segment’s survey fillout streaks.
5. Deepler Pillars scores & filters
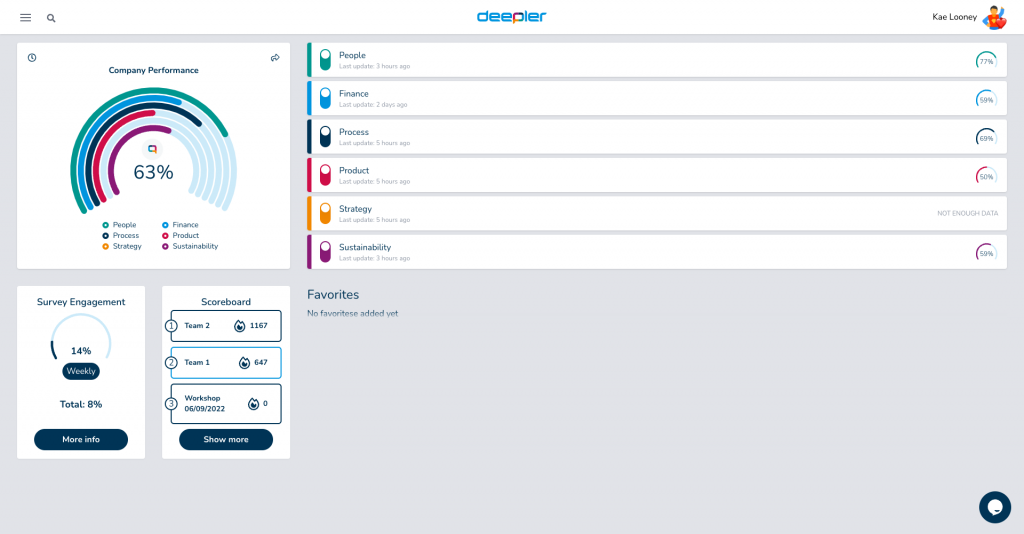
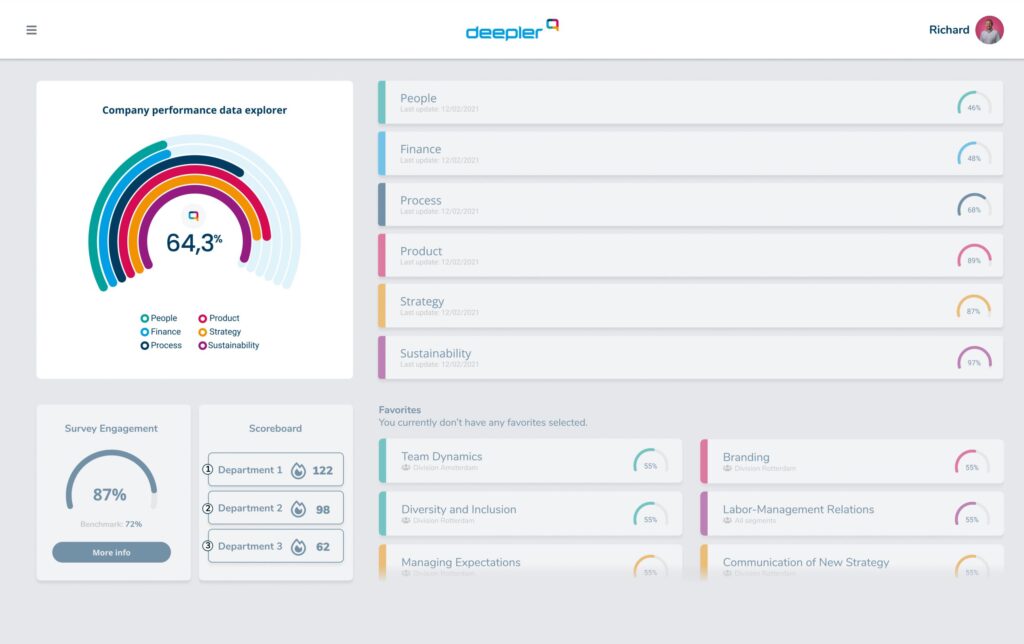
The Deepler Pillars refer to the six overarching aspects of your organisation we measure: People, Finance, Process, Product, Strategy and Sustainability. The buttons by the side of each main pillar allow you to turn on/off data collection for that pillar in the next employee survey.
Understanding Pillars
As shown here, when you click on a pillar, you are shown the main underlying variables or the ‘what you want’ variables of the said pillar. The variables have their scores and further underlying variables which are shown under ‘underlying topics’, they affect your organisation’s overall score. If you find variables that interest you, you can favorite them, so they are constantly shown on your Dashboard.
How to filter Deepler Pillars?
For your convenience, you can filter these scores by dates, segments, and functions within your organisation. You may also favorite the filtered scores so they appear on your Dashboard.
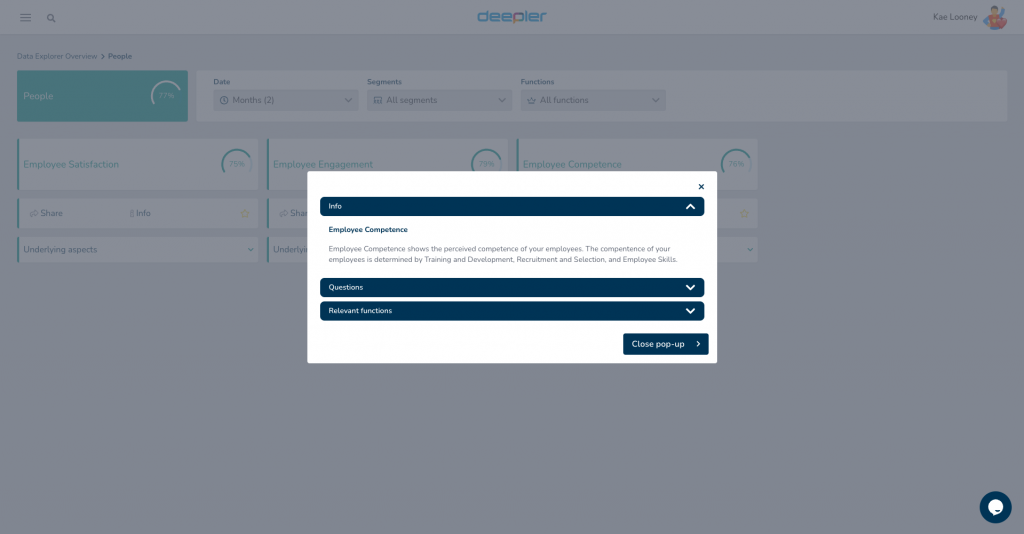
What does this Deepler variable measure?
If you wish to understand further what a topic refers to, you can learn more about that topic by clicking the ‘info’ button.
6. What are Deepler favourites ?
By looking at your ‘favourites’ tabs on your Dashboard, you can get a snapshot of how your ongoing improvements projects have affected your organisation’s scores.